Lecture 5: Classification
 HTML Slides
 PDF Slides
Classification loss functions and metrics
COMP 4630 | Winter 2025 Charlotte Curtis
Overview
- All the derivation thus far has been for mean squared error
- Cross-entropy loss is more appropriate for classification problems
- References and suggested reading:
- Scikit-learn book: Chapter 4, training models
- Scikit-learn docs: Log loss
- Deep Learning Book: Sections 3.1, 3.8, and 6.2
Revisiting the expected value
The expected value of some function when is distributed as is given in discrete form as:
where the sum is over all possible values of .
In continuous form, this is an integral:
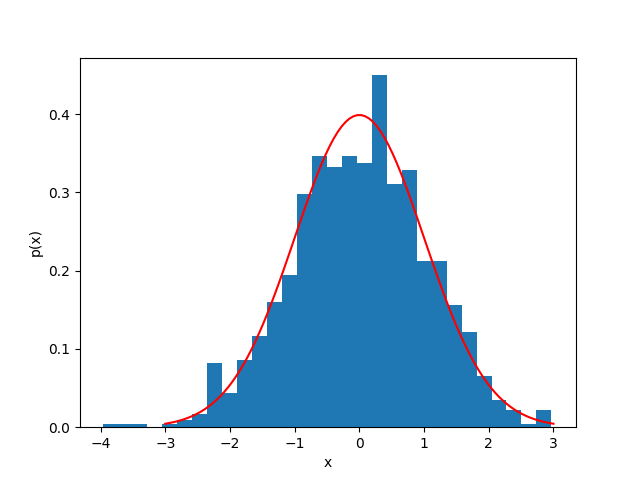
Binary case: Bernoulli distribution
- If a random variable has a probability of being 1 and a probability of being 0, then is distributed as a Bernoulli distribution:
- The expected value of is then:
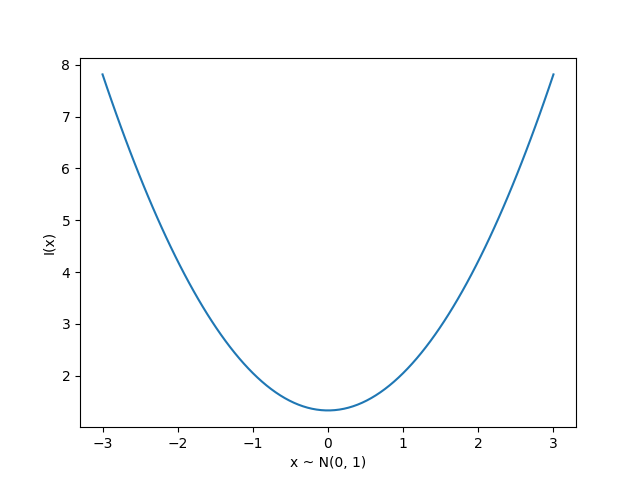
Information theory
Originally developed for message communication, with the intuition that less likely events carry more information, defined for a single event as:
Entropy
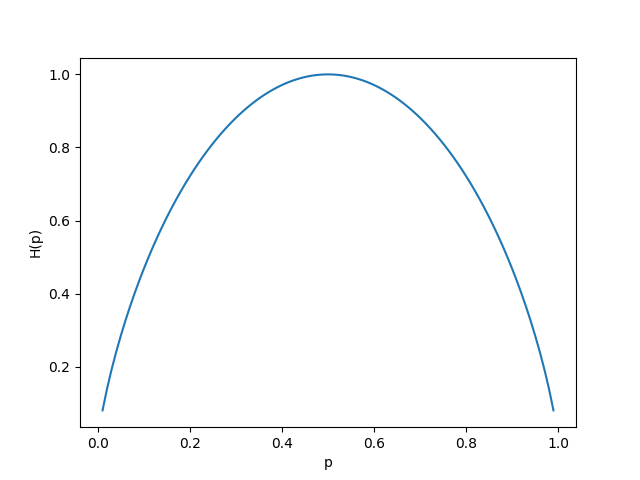
- We can measure the expected information of a distribution as:
- This is called the Shannon entropy
- Measured in bits (base 2) or nats (base )
- :abacus: Find the entropy of a bernoulli distribution
Cross-entropy
- The KL divergence is a measure of the extra information needed to encode a message from a true distribution using an approximate distribution :
- The cross-entropy is a simplification that drops the term :
- Minimizing the cross-entropy is equivalent to minimizing the KL divergence
- If , then and
Cross-entropy loss
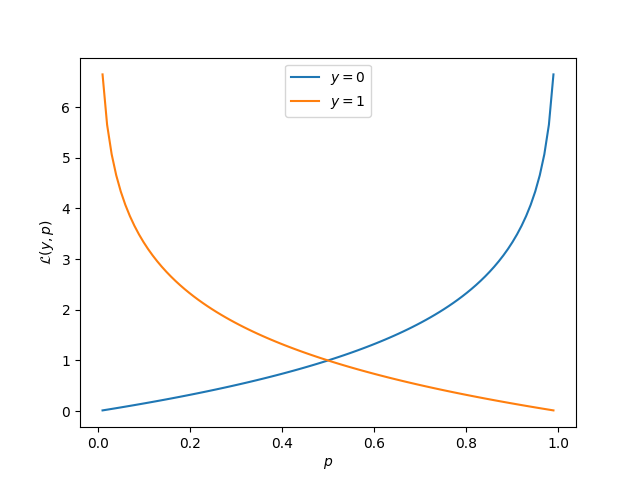
For a true label and predicted , the cross-entropy loss is:
where is the output of the final layer of a neural network (thresholded to obtain the prediction )
This is also called log loss or binary cross-entropy
Terminology for evaluation
-
True positive: predicted positive, label was positive () ✔️
-
True negative: predicted negative, label was negative () ✔️
-
False positive: predicted positive, label was negative () ❌ (type I)
-
False negative: predicted negative, label was positive () ❌ (type II)
-
Accuracy is the fraction of correct predictions, given as:
Precision and recall
-
Precision: Out of all the positive predictions, how many were correct?
-
Recall: Out of all the positive labels, how many were correct?
-
Specificity: Out of all the negative labels, how many were correct?
Confusion matrix
| Predicted Positive | Predicted Negative | |
|---|---|---|
| True Positive | TP | FN |
| True Negative | FP | TN |
- The axes might be reversed, but a good predictor will have strong diagonals
- There’s also the F1 score, or harmonic mean of precision and recall:
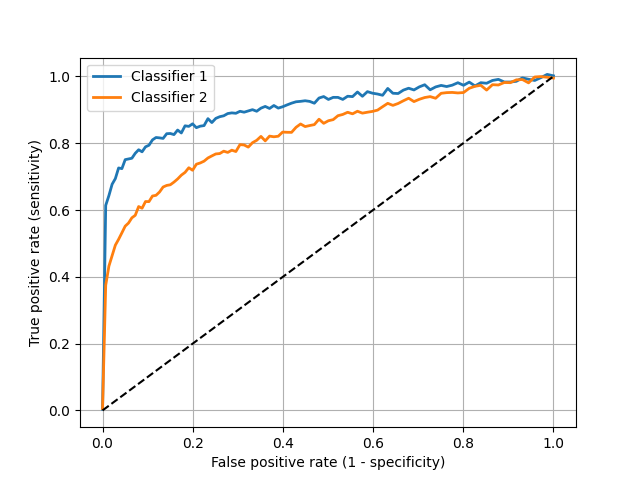
ROC Curves
-
The receiver operating characteristic curve is a plot of the true positive rate (recall or sensitivity) vs. false positive rate (1 - specificity) as the detection threshold changes
-
The diagonal is the same as random guessing
-
A perfect classifier would hug the top left corner
Fun fact: the name comes from WWII radar operators, where true positives were airplanes and false positives were noise
Which classifier is better?
Multiclass case
- For classes, the output is a vector with
- The cross-entropy loss is then:
- For a one-hot encoded vector , this simplifies to: where is the index of the true class
The softmax function
-
For binary classification, the sigmoid function is used to predict the probability of the positive class
-
For multiclass classification, the softmax function is used:
where is the output of neuron in the final layer before the activation function is applied
-
This means that neurons are needed in the final layer, one for each class